
Useful System Tools Hidden in Windows part 2
How to use Resource Monitor Tool
Resource Monitor displays real-time feeds of data about the critical systems of your PC. It’s a free utility that comes bundled with Windows 7 and Vista, and it’s very useful for monitoring your computer’s health and troubleshooting performance problems. To open Resource Monitor:
1. Press Ctrl-Shift-Esc) to open Task Manager.
2. Click the Performance tab.
3. Click the Resource Monitor button in the bottom right of the screen.
Resource Monitor looks slightly different in Windows 7 from how it looks in Windows Vista, but its basic functions are unchanged.

Overview

The Overview section provides a self-updating line graph for each of the four subsections: CPU, Disk, Network, and Memory. In Windows 7, you can also check the box next to a CPU process and see details related to that process alone. If you see a constant high level of unexpected activity in any these graphs, you a malfunctioning program or malware may be resopnsible. To troubleshoot, explore the other sections in Resource Monitor.
CPU
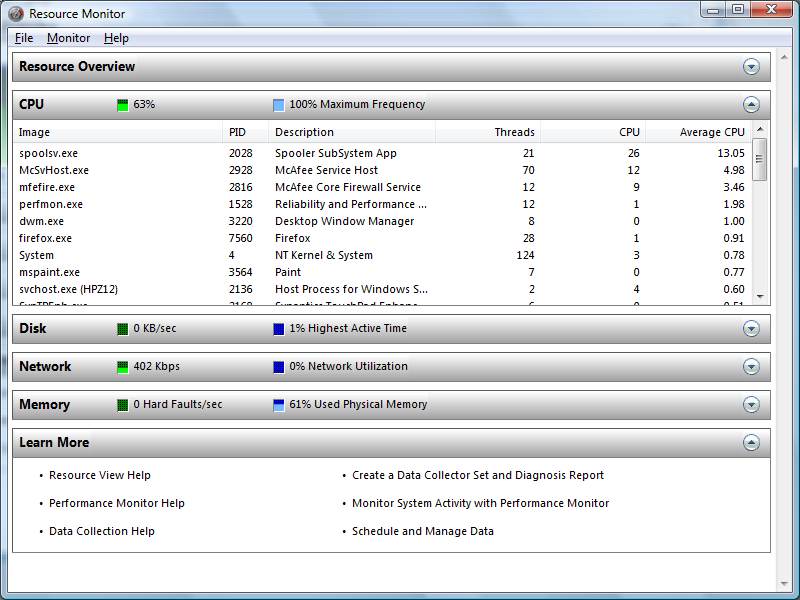
In Windows 7, the CPU section contains four subsections: Processes, Services, Associated Handles, and Associated Modules.
1. You can sort processes by clicking any of the column headings under Processes. Processes listed in red are nonresponsive; you can terminate them by right-clicking and choosing End Process from the context menu.
2. Try sorting the processes by Average CPU. Check the box next to any CPU-hogging entries to bring up detailed information in the other subsections.
3. Use the information you see to figure out where power-hungry processes are hiding.
Windows Vista allows you to view and sort processes as well, but it does not include the detailed subsections that Windows 7 provides.
Disk

The Disk section reveals where activity is occurring on your hard disk drive. If your hard disk activity light remains lit up constantly, this section will help you figure out the cause(s). In Windows 7, Resource Monitor will also show which processes are associated with disk activity and allow you to terminate them.
Network
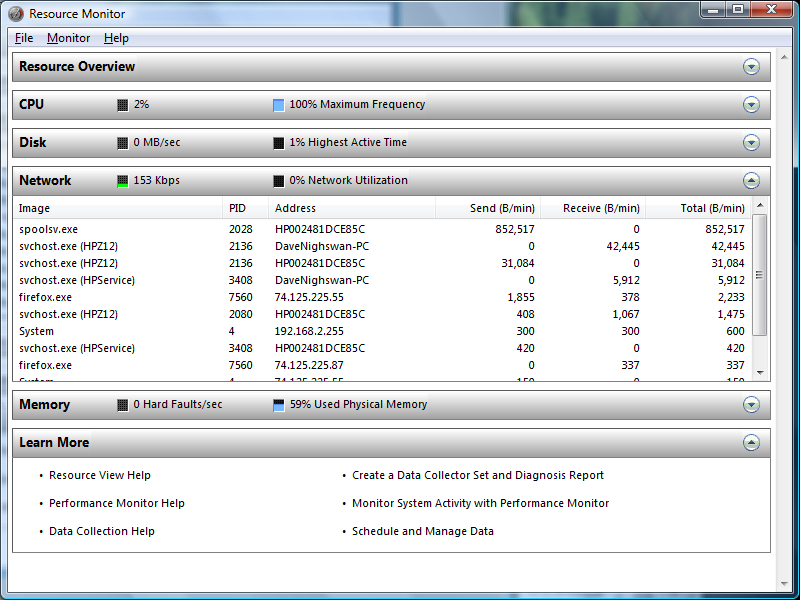
The Network section displays details about network activity. If you’re using Windows 7, pay special attention to the first subsection, ‘Processes with Network Activity’. To diagnose slow network performance, sort and highlight entries on this list to find out what is hogging your bandwidth. In Vista, the available details are more limited, but you can still sort and terminate processes.
Memory

The Memory section shows you the processes that are using physical memory (RAM). Sort by Commit to see which programs are most memory-intensive. The higher the percentage of used physical memory is, the more likely you’ll be to see high numbers of Hard Faults/sec. A hard fault occurs when Windows has to access the swap file–reserved hard disk space used when RAM runs out. Despite their name, hard faults are not errors. But if your system is experiencing hundreds of hard faults per second, either you need a RAM upgrade or a process is hogging resources.
Follow these steps and you’ll soon be using the Resource Monitor with aplomb. Be sure to check back every few months and repeat the process to ensure that your PC is running error-free at optimum efficiency.
In next tutorial i will write about another hidden tool in windows Performance Monitor
Related Posts


About The Author
AYYU
I am a blogger since 2010 and I’m the author of this website I'm a systems/network administrator and I enjoy solving complex problems and learning as much as I can about new technologies. I write tutorials based on my work experience and other IT stuff I find interesting. since 2006 in online world also I am a troubleshooter for the well-known website like http://www.fixya.com and many more groups